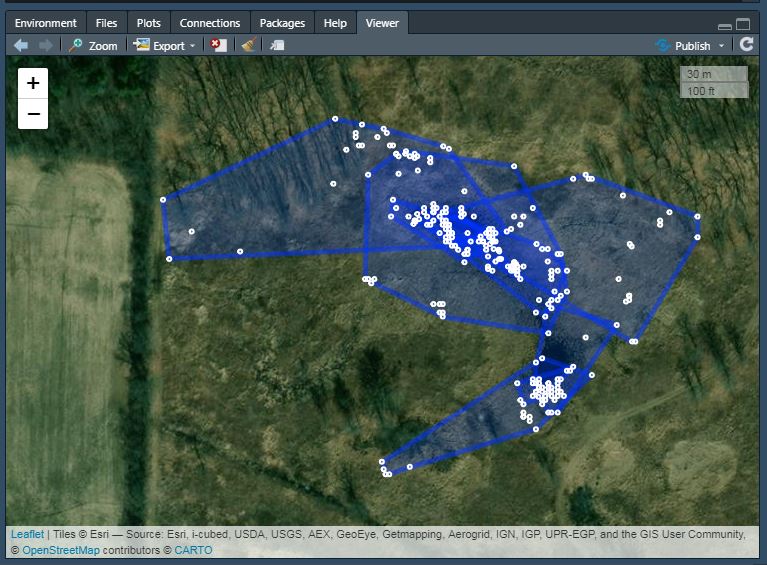
Use adehbabitatHR to calculate and plot home ranges in R, export a table of those home ranges, calculate summary statistics, and then plot them in R using leaflet.
This code is based on the awesome tutorial by James Patterson, with some of my own modifications.See his tutorial here: https://jamesepaterson.github.io/jamespatersonblog/03_trackingworkshop_homeranges
This code is based on the awesome tutorial by James Patterson, with some of my own modifications.See his tutorial here: https://jamesepaterson.github.io/jamespatersonblog/03_trackingworkshop_homeranges