Sorting through thousands (or hundreds of thousands) of camera trap photos is time consuming. Some tools exist to make this process easier, such as camtrapR (https://cran.r-project.org/web/packages/camtrapR/index.html), which can automatically extract relevant metadata (e.g. the time the photo was taken) from the individual image files. However, metadata can be fickle, and in the case of time, this can easily be corrupted if the files have been moved or copied.
In my case, I wanted the time data so I could examine the activity periods of mesocarnivores inhabiting suburban preserves. So, instead of manually entering the time data for thousands of images, I developed this R script to save me some time and reduce the rate of transcription errors. That said, I’m a field biologist and not a professional coder, so this code isn’t perfectly efficient or universal, and you’ll need to modify it to suit your individual needs.
These are the essential commands, in case you don't want to read the whole thing:
magick::image_read()
magick::image_crop()
tesseract::ocr_data()
Now for everyone else, before you start, make sure you have the following packages installed:
tesseract
magick
lubridate
tidyverse
exifr
tesseract does the OCR (optical character recognition). In other words, this is the package that converts the time stamp on the image to text that we can then analyze instead of typing it in manually.
magick is used to manipulate the image files and get them ready for the OCR.
lubridate is a package that makes working with dates and times much easier than base R.
tidyverse is a quick way to load a bunch of different packages that I use frequently, such as stringr (working with character strings), dplyr (data manipulation), and ggplot2 (graphing).
exifr is a package that extracts metadata from image files. For this package, you need another programming language installed on your computer, “Perl”. See https://github.com/paleolimbot/exifr for easy to follow instructions. I went with Strawberry Perl (http://strawberryperl.com/) as I have a Windows machine.
Ok, first load your libraries:
Code Editor
For this example, I’m just working with domestic cat images. The images from the long-term dataset I’m working with are saved in a folder called MammalImages, which then has an individual folder for each year of data collection (2008–2018), and then a folder for each individual camera location (n = 259). When the images were initially sorted, the file name included the code of the animal (e.g. DOCA for domestic cat).
This next chunk of code uses the exifr package to scan through the MammalImages folder (and all subfolders) and pull out the file path and camera model from only the images with DOCA in their file name. The camera model part will come into play a bit later. Note that the “tags” argument is different than then “pattern” argument. Pattern is part of the list.files function and is where you include your search terms. “tags” is from the read_exif function and is used to include which metadata (EXIF) data categories you want to extract.
Depending on how many files you have, this will take a bit. In my case, it took about 2 minutes to find 326 images in a folder containing 172 gigabytes of images.
Code Editor
Next, I want to extract the file name from the file path (e.g the previous folder information), as well as the camera location (in my case, this is the wildlife monitoring point; WMP) and the year the data was collected. I also create a new empty column that we will fill in the next step. Here’s an example of what the “sourcefile” looks like, so you can see what I’m pulling out:
F:/WMP_MammalImages//2008/LAK-L-113/N4_DOCA(1)_0017.JPG
F:/WMP_MammalImages//2008/LAK-L-113/N4_DOCA(1)_0017.JPG
I now want to copy the images to a new folder, because you NEVER want to mess with the original files. Basically, I create a copy of each original files in a new location but give each one a better (more informative) name. You can skip the renaming step if your files already have informative names, but mine don’t (e.g N4_DOCA(1)_0017.JPG).
Note: Be careful renaming files, as you can permanently mess up your data. I would recommend doing this on data you have already backed up (because you’re already doing that, RIGHT?)!
Note: Be careful renaming files, as you can permanently mess up your data. I would recommend doing this on data you have already backed up (because you’re already doing that, RIGHT?)!
Ok, so what the hell was all that? Well, I utilized a “for loop”, iterating through the data by a variable I’m calling “row”, which refers to the maximum number of rows in my data (so, 1 to 324). Then, I use stringr:str_c to create a string of what I want each new file to be using paste to combine the year, WMP, row, and “DOCA”. Thus, the above code:
### Create new name for copied images
CAT2[row, 6] <-
stringr::str_c(CAT2[row, 5],
CAT2[row, 4],
row, # add the row number
"DOCA",
sep = "_")
would result in 2008_LAK-L-113_1_DOCA (much better than N4_DOCA(1)_0017!). In my data, column 6 was NEW_FILE, column 5 was YEAR, column 4 was WMP (the syntax for subseting data using brackets is [row, column]). Then, I used the paste function to tell file.rename which file we were renaming, and what to change it to. Paste works similarly to str_c. Once the loop is done, all my cat images are together in one folder, with a new name that is more informative than the old name.
Note 1: I could have called “row” anything, like “puppy” or “covfefe.” But row seemed intuitive.
Note 2: I could have simply typed in 324 (the number of rows) instead of using the nrow function, but nrow gives flexibility as this number isn’t always the same (like if I wanted to use this code to analyze my coyote images).
Note 3: This can take some time, so I initially created a smaller subset of my data to practice on while making sure the code worked as intended. For example: CAT_TEST <- dplyr::slice(CAT, 1:5). I would recommend you do this, too.
Note 4: People hate for loops. An alternative might be the map() function from the purrr package.
Alrighty, now that the images are organized in one folder, we can start the image processing!
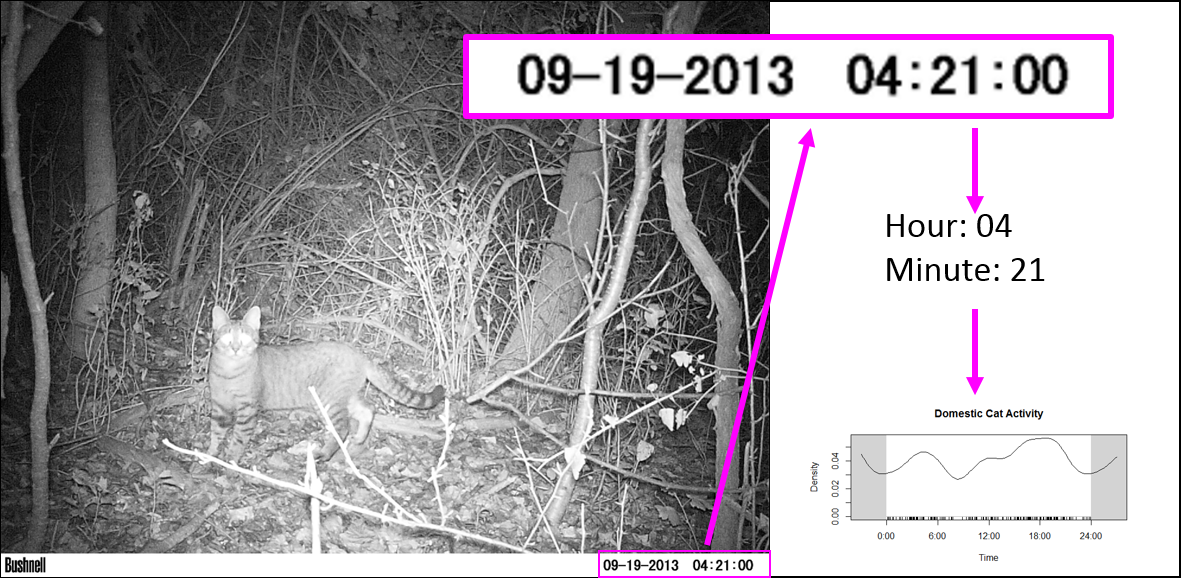
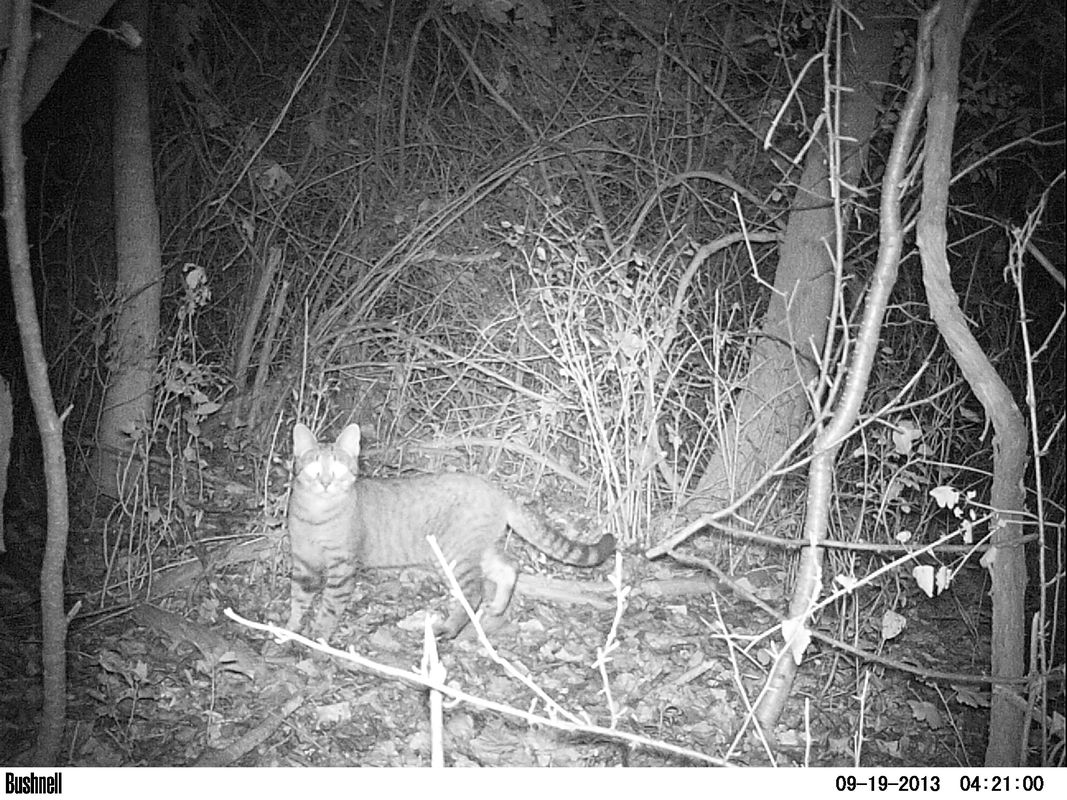
First, I want to get all the file names together so I can rename them (again) using the date and time data extracted directly from the photo (not the metadata). Then, load the image into the R environment, and then (within a for loop), crop each image to the date/time stamp, use OCR to extract the text, save the text, and rename the file using this new data.
Visually, here are the steps to loading, cropping, and extracting:
CAT_IMAGE <- magick::image_read(F:/WMP_MammalImages//2018/SIN-B-103/DOCA6.JPG) # import image
CAT_IMAGE #view image
### Create new name for copied images
CAT2[row, 6] <-
stringr::str_c(CAT2[row, 5],
CAT2[row, 4],
row, # add the row number
"DOCA",
sep = "_")
would result in 2008_LAK-L-113_1_DOCA (much better than N4_DOCA(1)_0017!). In my data, column 6 was NEW_FILE, column 5 was YEAR, column 4 was WMP (the syntax for subseting data using brackets is [row, column]). Then, I used the paste function to tell file.rename which file we were renaming, and what to change it to. Paste works similarly to str_c. Once the loop is done, all my cat images are together in one folder, with a new name that is more informative than the old name.
Note 1: I could have called “row” anything, like “puppy” or “covfefe.” But row seemed intuitive.
Note 2: I could have simply typed in 324 (the number of rows) instead of using the nrow function, but nrow gives flexibility as this number isn’t always the same (like if I wanted to use this code to analyze my coyote images).
Note 3: This can take some time, so I initially created a smaller subset of my data to practice on while making sure the code worked as intended. For example: CAT_TEST <- dplyr::slice(CAT, 1:5). I would recommend you do this, too.
Note 4: People hate for loops. An alternative might be the map() function from the purrr package.
Alrighty, now that the images are organized in one folder, we can start the image processing!
First, I want to get all the file names together so I can rename them (again) using the date and time data extracted directly from the photo (not the metadata). Then, load the image into the R environment, and then (within a for loop), crop each image to the date/time stamp, use OCR to extract the text, save the text, and rename the file using this new data.
Visually, here are the steps to loading, cropping, and extracting:
CAT_IMAGE <- magick::image_read(F:/WMP_MammalImages//2018/SIN-B-103/DOCA6.JPG) # import image
CAT_IMAGE #view image
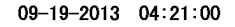
CAT_IMAGE2 <- magick::image_crop(image = CAT_IMAGE, geometry = "774x96+2490+2352") #crop image
CAT_IMAGE2 #view image
CAT_IMAGE2 #view image
DATE_TIME <- tesseract::ocr_data(CAT_IMAGE2) # ocr the cropped image
DATE_TIME #view the OCR'd text
DATE_TIME #view the OCR'd text
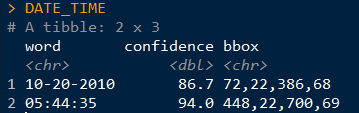
Thus, we can then extract the time and date from the DATE_TIME object. The order will depend on how your image strip looks.
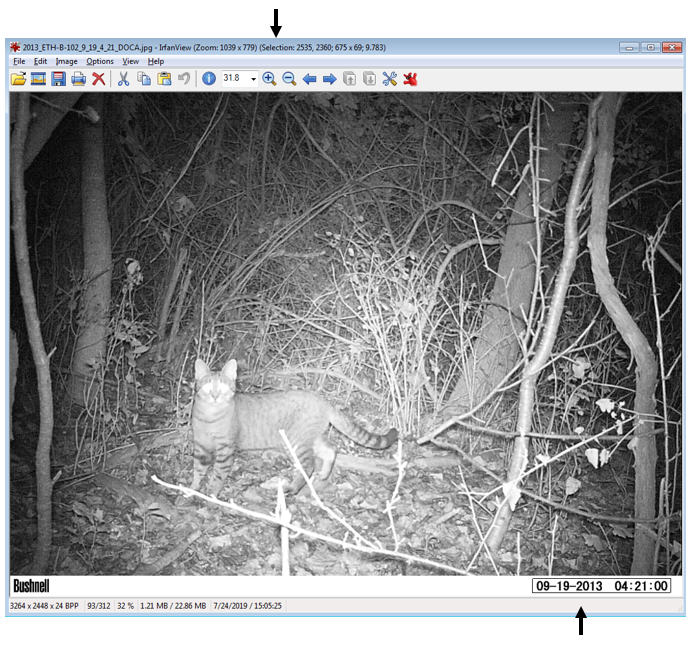
For the magick::image_crop command, the numbers "726x98+2490+2352" are the coordinates, in pixels, of the boundary I want to crop. This will depend on your photos. To get this number, I opened one of my photos in the free program IrfanView (https://www.irfanview.com/), and simply held my left mouse button down to draw a selection box around the area I was interested in. Then, I simply took the coordinates it displays at the top of the window and applied them to the format:
Width x height + x offset + y offset
In other words, crop out a box of width 726 and height 98, starting at 2535 pixels from the right and 2360 pixels from the top.
You can get the pixel dimensions how ever you want, but that’s how I did it.
Now, here’s the code wrapped in a loop. Remember when I initially mentioned saving the camera brand? Well, we used three different types of cameras over the 10 years. The different types of cameras have different time strips, so they require different coordinates for cropping. So, the following code only apples to my Bushnell images, which was the overwhelming majority of photos. I simply moved the other cameras to a different folder and modified the code to OCR them.
Don’t forget that last closing swiggly bracket, or the loop won’t work!
Note: The final line, cat("image renamed","\n\n"), is just to tell R to print the words “image renamed" followed by line breaks. I don’t know why \n means line break, but I assume it is a holdover from earlier years of programming. Also, the cat function doesn’t mean a feline, it is short for concatenate. This actually messed me up as I was switching the code over to analyze my coyote data, as I used search and replace to change all instances of CAT to COYOTE. Well, that wound up breaking my entire loop and took me 15 minutes to figure out because it changed cat("image renamed","\n\n") to coyote(“image renamed","\n\n")! Whoops...
Finally, you’ll want to save all the work you just did. To do so, I use this code:
write.table(CAT4, "clipboard-100000", row.names = F, sep = "\t")
That takes all the OCR data, now saved in CAT4, puts it on the clipboard without row names, and let’s you paste it into excel. There are plenty of ways you could do this, but this is how I did it. If your data set is huge, and you get an error message, you can increase the number after clipboard-.
That’s it, hope you learned something! Feel free to ask questions or advice for making the code better, leave it in the comments or hit me up on Twitter at @wild_ecology. Below is a link to the code in entirety so you can just copy and paste it as you see fit.
Finally, thanks to Andrew Durso of the blog Snakes are Long (http://snakesarelong.blogspot.com/) and Neil Saunders (@neilfws) for the suggestion that tesseract might help to solve this problem.
PS: Here's the cat activity graph that I originally needed the data for:
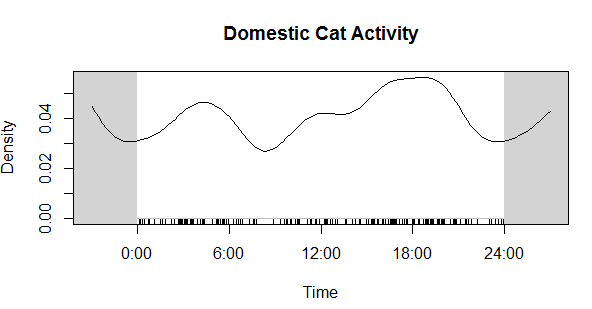
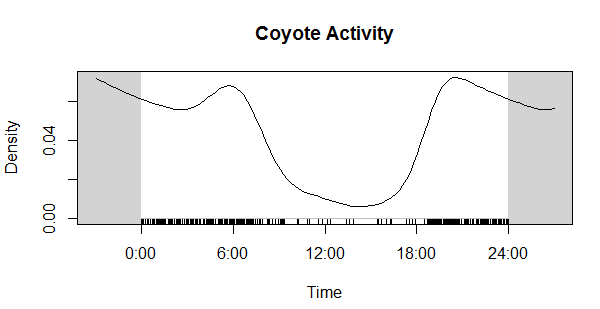
Now compare that to the coyote data. Much different! Cats in our preserves don't seem to be be noctural, diurnal, or crepuscular, whereas coyotes are decidedly nocturnal, as expected.
| 04_extract_camera_times.r |
