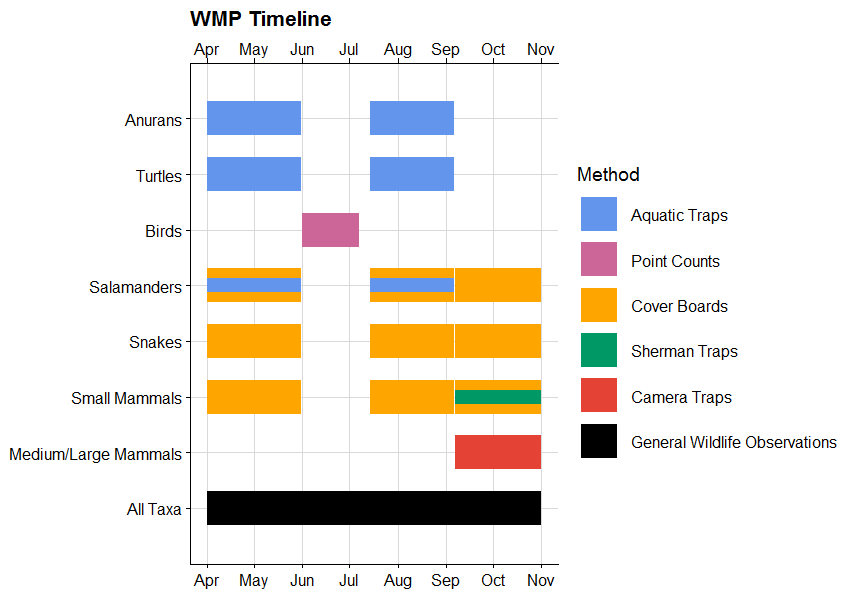
Here is the R code I used to make a Gannt chart displaying a muli-taxa wildlife monitoring timeline with different survey types. It's based on the code from: https://www.molecularecologist.com/2019/01/simple-gantt-charts-in-r-with-ggplot2-and-the-tidyverse/.
My main modification is the overlapping colors to display two techniques used to monitor the same taxa at the same time.
My main modification is the overlapping colors to display two techniques used to monitor the same taxa at the same time.